
Are you running an e-commerce business or thinking about starting one? You’ve come to the right place.
We’ve compiled a list of the most important e-commerce statistics that are reshaping online retail.
Scroll through the full list or jump to a section to learn how e-commerce is evolving and what trends matter most.
Key e-Commerce Statistics in 2026
- More than 2.7 billion people shop online, which is over one-third of the global population.
- Mobile commerce drives over 60% of all ecommerce transactions worldwide.
- China leads globally in ecommerce, generating more than $3 trillion in annual online sales.
- Shopify powers over 4.8 million stores and handles over $500 billion in total sales volume.
- WooCommerce and Shopify together account for nearly 50% of all ecommerce stores.
- Buy Now, Pay Later (BNPL) services drove $133 billion in spending in the U.S. alone.
- Email marketing drives up to 20% of ecommerce traffic, with cart recovery emails converting up to 12%.
- Digital wallets are used in nearly half of all ecommerce checkouts.
- Consumer electronics is the highest-spending category, with $988 billion in annual online sales.
- Cart abandonment rates hover near 70%, mostly due to unexpected fees, forced signups, or slow delivery.
eCommerce Statistics by Platform
- Shopify powers over 4.8 million online stores globally.
- WooCommerce and Shopify together account for nearly 50% of the world’s ecommerce platforms.
- 37.5% of ecommerce websites using hosted platforms run on Shopify.
- Amazon holds 37.6% of the total ecommerce market share in the U.S.
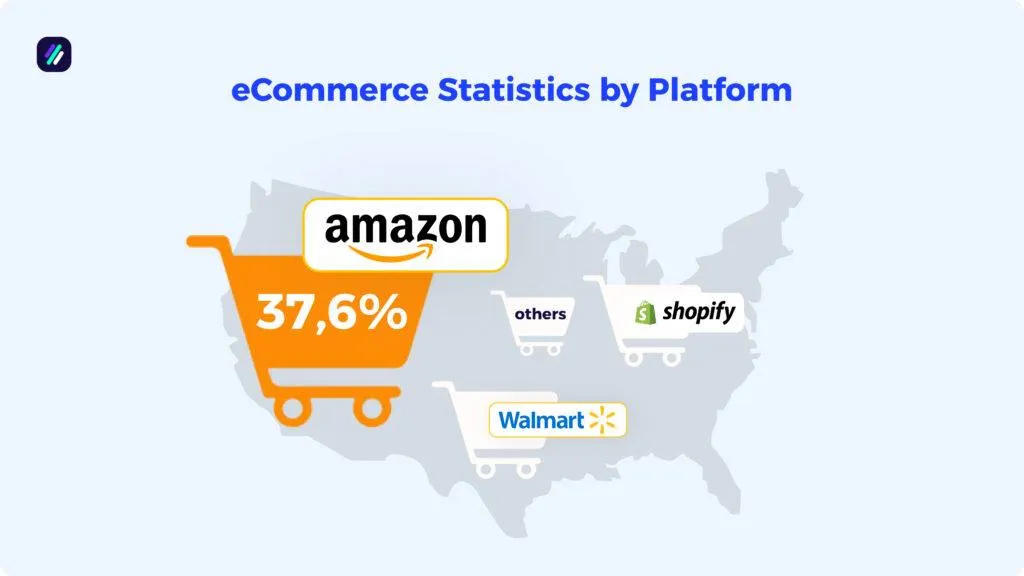
- Walmart is the second-largest ecommerce platform in the U.S. by market share (6.4%).
- TikTok Shop and Instagram Shopping are emerging as active commerce platforms, especially among Gen Z.
- The average Shopify store uses 6 apps, while Shopify Plus stores may use over 15.
- Shop Pay offers checkout speeds up to 4x faster than standard payment options.
eCommerce Statistics by Industry
- B2B ecommerce is valued at over $32 trillion and is expected to hit $36 trillion by next year.
- Consumer electronics lead ecommerce spending at $988.4 billion.
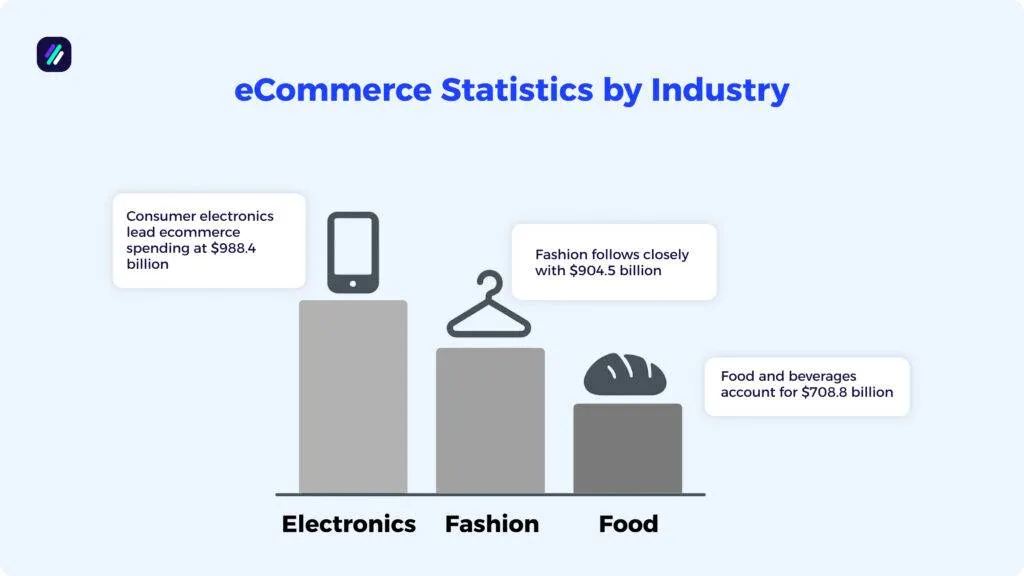
- Fashion follows closely with $904.5 billion in global ecommerce sales.
- Food and beverages account for $708.8 billion in ecommerce spending.
- The beauty and personal care industry brings in $169.6 billion in online sales.
- Furniture ecommerce sales reach $220.1 billion globally.
- Subscription ecommerce is projected to surpass $450 billion in value.
- Mobile commerce (m-commerce) accounts for 60%+ of global ecommerce transactions.
eCommerce Statistics by Country
- China is the largest ecommerce market in the world, generating over $3 trillion in annual sales.
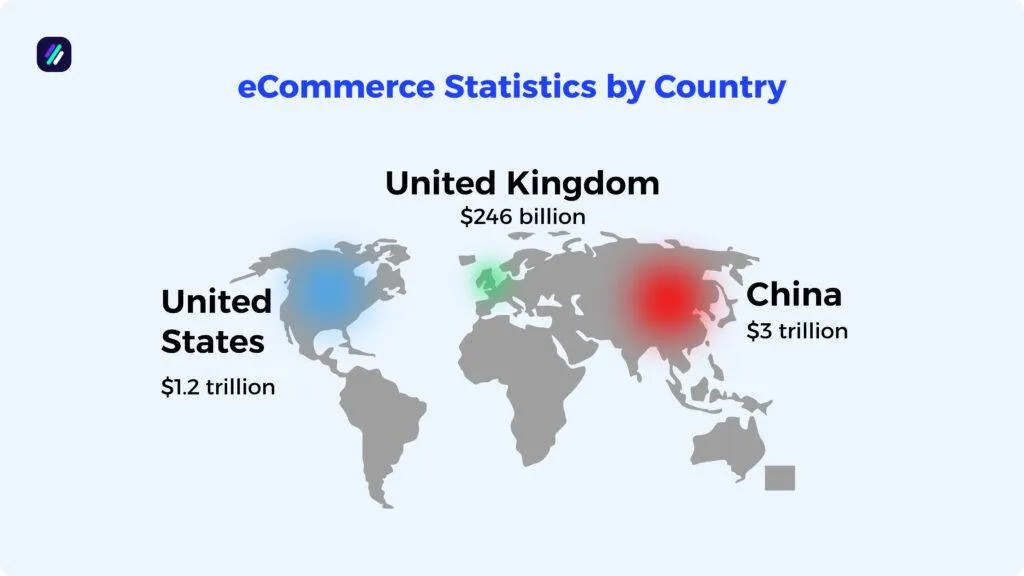
- The United States follows with more than $1.2 trillion in ecommerce revenue.
- The United Kingdom generates around $246 billion in ecommerce sales, making it the largest in Europe.
- Japan’s ecommerce market brings in about $169 billion annually.
- India’s ecommerce market is worth over $83 billion and growing rapidly.
- Mexico, Vietnam, and the Philippines are among the fastest-growing ecommerce markets by annual growth rate.
- South Korea, Indonesia, and the UK each have more than 30 percent ecommerce penetration.
- Canada, Germany, and France each generate over $60 billion in ecommerce revenue yearly
eCommerce Statistics by Category
- Apparel is the most popular ecommerce category by store count, making up over 18 percent of all stores.
- Home and garden accounts for nearly 12 percent of ecommerce stores globally.
- Food and drink stores make up 8.5 percent of all ecommerce stores.
- Arts and entertainment leads all categories in monthly sales, totaling over $3 trillion.
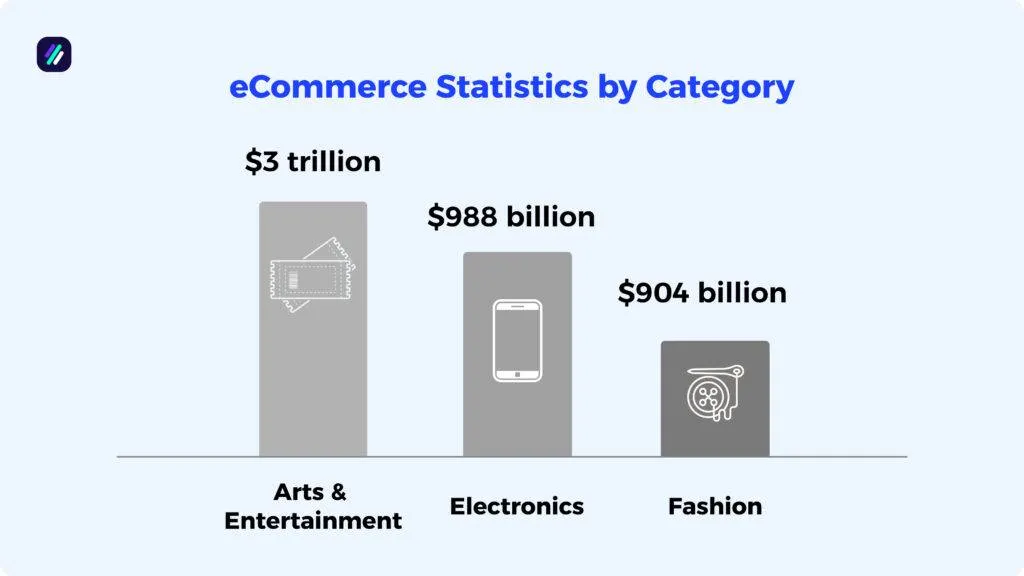
- Consumer electronics is the highest-spending ecommerce category, with $988 billion in global sales.
- Fashion ranks second in spending, with $904 billion in ecommerce sales.
- Beauty and personal care brings in $169 billion annually through online shopping.
- Subscription ecommerce is projected to reach $450 billion in market value.
eCommerce Traffic and Device Statistics
- Most online shopping happens on phones now, with over 74% of traffic coming from mobile.
- More than 60% of online orders are placed using a phone.
- Tablets have the highest ecommerce conversion rate at 3.1 percent, followed by desktops at 2.8 percent.
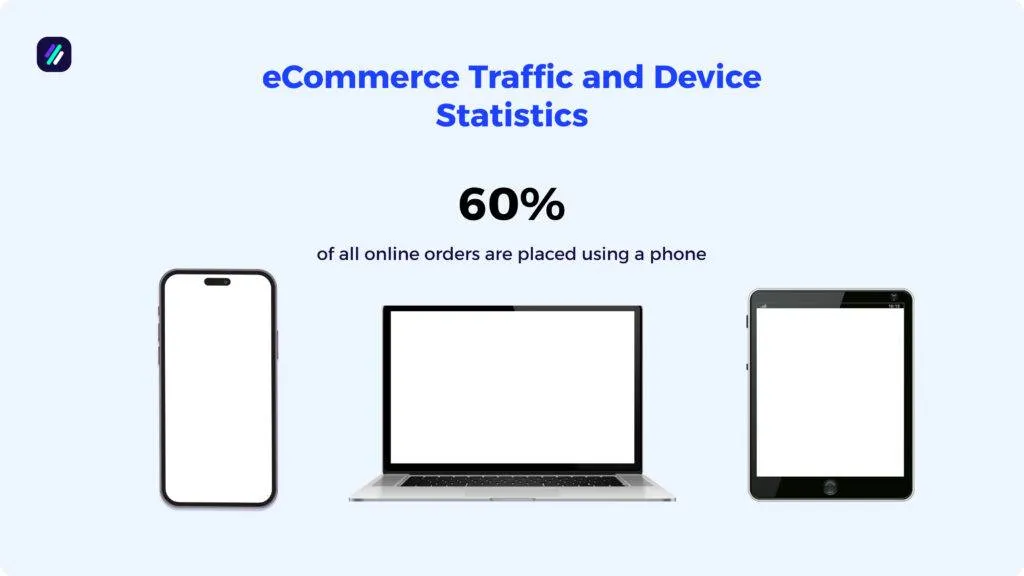
- In countries like the US, China, and India, phones are the most common way to shop online.
- Digital wallets are used in nearly half of all online checkouts.
- Retail m-commerce sales are projected to exceed $2.5 trillion this year
eCommerce Consumer Behavior Statistics
- More than 2.7 billion people shop online, which means about one in three people around the world buy things over the internet.
- Around 8 out of 10 shoppers do some research online before they decide to buy.
- Over half of online shoppers are open to buying from international stores.
- 75 percent of online purchases are repeat purchases.
- 34 percent of global shoppers buy online at least once a week.
- Nearly 70% of shopping carts get abandoned before checkout, usually because of extra fees, slow shipping, or forced account signups.
- 54 percent of shoppers consider sustainable packaging in their purchase decisions.
- About 99% of customers read reviews before purchasing, and nearly all of them check for negative ones too.

- Shoppers view an average of 25 to 32 product pages before making a decision in categories like fashion and groceries.
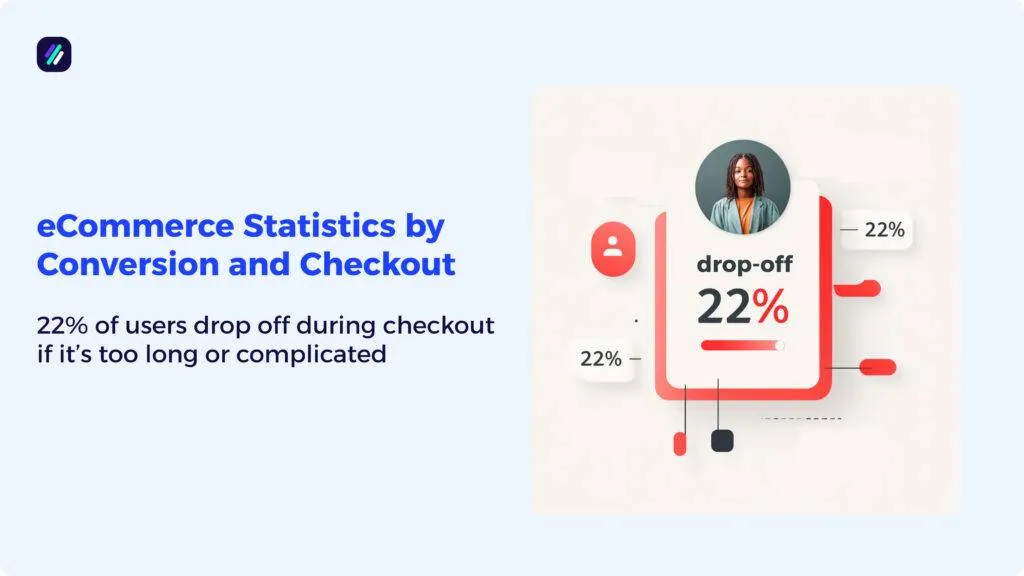
eCommerce Statistics by Conversion and Checkout
- The average ecommerce conversion rate is around 2%, varying by device and industry.
- Tablet users convert at a higher rate (3.1%) than desktop (2.8%) and mobile (2.3%).
- Stores with a three-step or shorter checkout process see lower cart abandonment.
- 22% of users drop off during checkout if it’s too long or complicated.
- Nearly 50% of online purchases are made using digital wallets.
- Buy Now, Pay Later transactions reached $133 billion in the U.S. last year.
- Mobile checkout now accounts for nearly 74% of all ecommerce traffic.
- Stores using Shop Pay can see checkout speeds up to 4x faster than standard options.
eCommerce Statistics by Social and Mobile Shopping
- Over 60% of all ecommerce transactions happen on mobile devices.
- 74% of ecommerce traffic comes from mobile, but conversion rates are still slightly lower than desktop.
- In the U.S., over 96 million people shop through social media platforms.
- Stores with an active social media presence see 32% more sales on average.
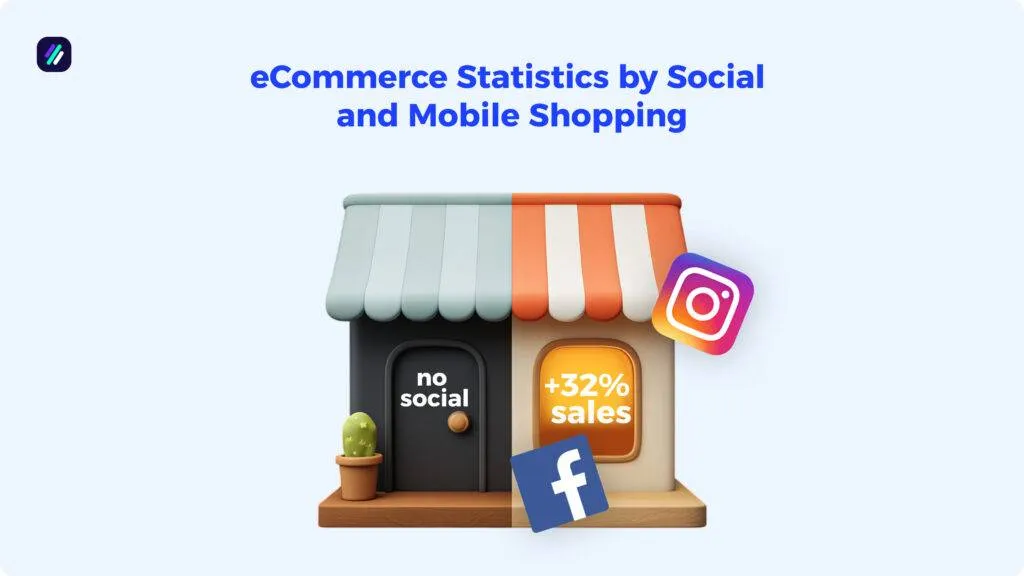
- Facebook is the top platform for social shopping, with 50.7% of buyers making purchases there.
- Instagram follows with 47.4%, while TikTok is growing fast, especially among Gen Z.
- Video content on social media leads to significantly higher engagement and conversions.
eCommerce Statistics on Email and Retention
- Email marketing drives up to 20% of total ecommerce traffic for many stores.
- Cart abandonment emails have open rates around 45% and recover between 5% to 12% of lost sales.
- Welcome emails are opened by nearly 69% of recipients, making them the highest-performing email type.
- Over 60% of online shoppers say they’ve made a purchase from a brand email.

- 49% of shoppers want to receive promotional emails from their favorite brands every week.
- Personalized emails see 50% higher open rates than generic ones.
- Loyalty programs and email flows help drive 41% of total revenue in established ecommerce stores.
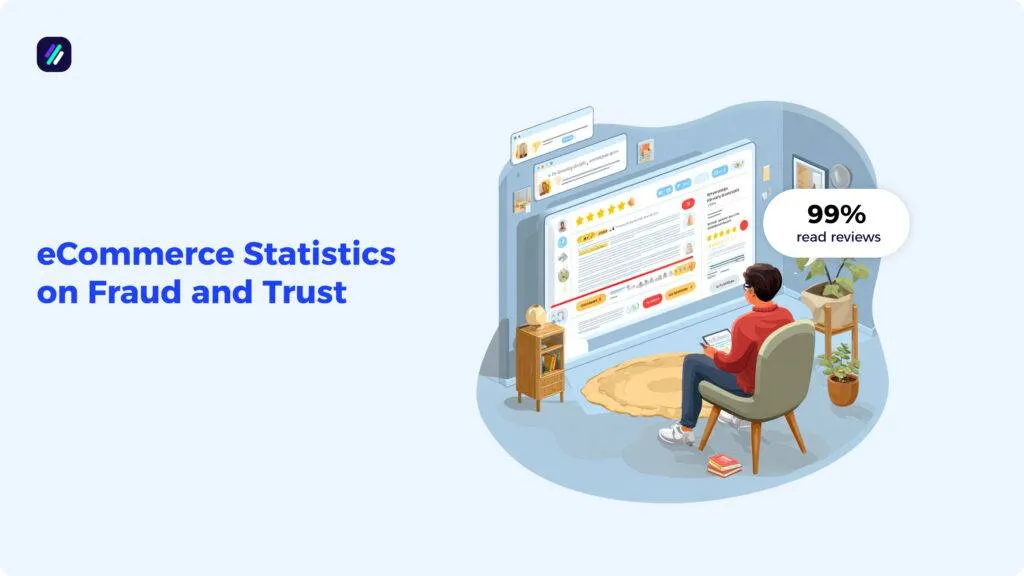
eCommerce Statistics on Fraud and Trust
- Online payment fraud caused $48 billion in losses globally in the last year.
- North America loses around 2.4% of ecommerce revenue to fraud each year.
- Latin America sees the highest fraud-related losses, averaging 4.2% of total ecommerce sales.
- 99% of online shoppers check reviews before making a purchase, and 96% specifically look for negative ones.
- About 70 percent of consumers are okay with brands using their data, as long as it’s done responsibly.
- Only 33% of customers believe brands use their data ethically, while 42% feel their data is being exploited.
eCommerce Statistics on Shipping and Fulfillment
- 84% of online shoppers say clear delivery timelines influence whether they complete a purchase.
- Most customers expect standard delivery to arrive within 7 to 10 business days.
- Stores using local fulfillment centers see up to 50% fewer complaints from repeat buyers.
- Return rates for ecommerce stores typically fall between 5% and 8%.
- USPS is the most commonly used shipping carrier for Shopify merchants.
- Free shipping remains the top purchase driver for 50.6% of global shoppers.
- 33.2% of shoppers say easy returns make them more likely to buy again.
Other Statistics Posts:
- 70 Important Shopify Statistics
- 60 Important Dropshipping Statistics
- 47 Important Product Research Statistics
- 80+ Important Print on Demand Statistics
- 59 Important eBay Statistics
Handy E-commerce Guides
- How to Sell on Shopify: From Setup to Success
- An Essential Guide to Ecommerce Branding for Sellers
- Top 10 Online Marketplaces to Sell Your Products
- Dropshipping vs Wholesale: Which One is Right For You?