
Are you thinking about starting a print-on-demand business, or want to see if it’s worth it? You’ve come to the right place.
We’ve gathered the key print-on-demand statistics that show you the real opportunity, from market size and profit potential to what products customers actually buy.
Check out the numbers below to see if POD is the right move for your e-commerce business in 2026
Key Print on Demand Statistics
- The global POD market is worth over $12 billion and could hit $19.8 billion by 2029.
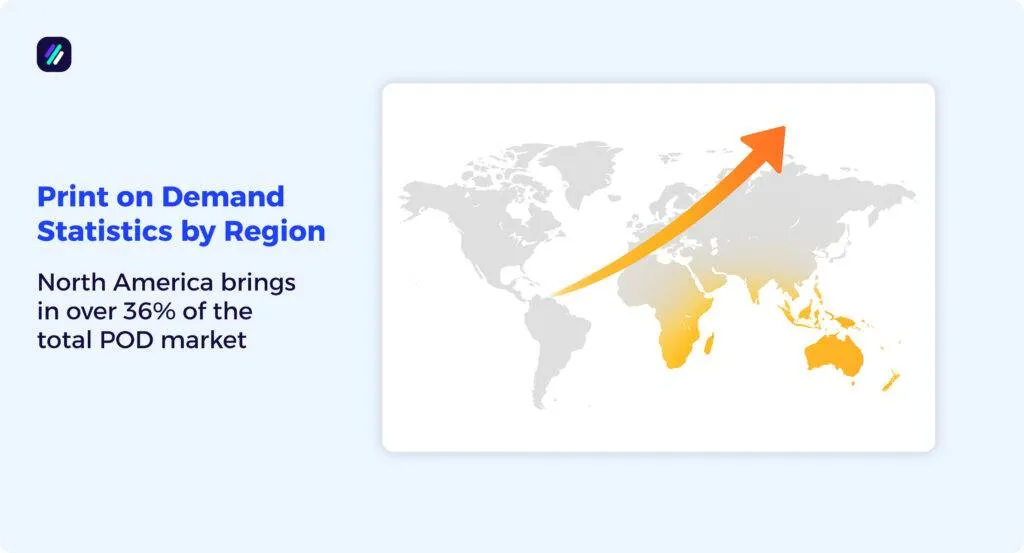
- North America drives over 36% of all POD revenue, with the U.S. leading in both sales and seller count.
- Apparel makes up nearly 40% of POD sales, with t-shirts as the top-selling product.
- T-shirts alone account for over 60% of all POD orders.
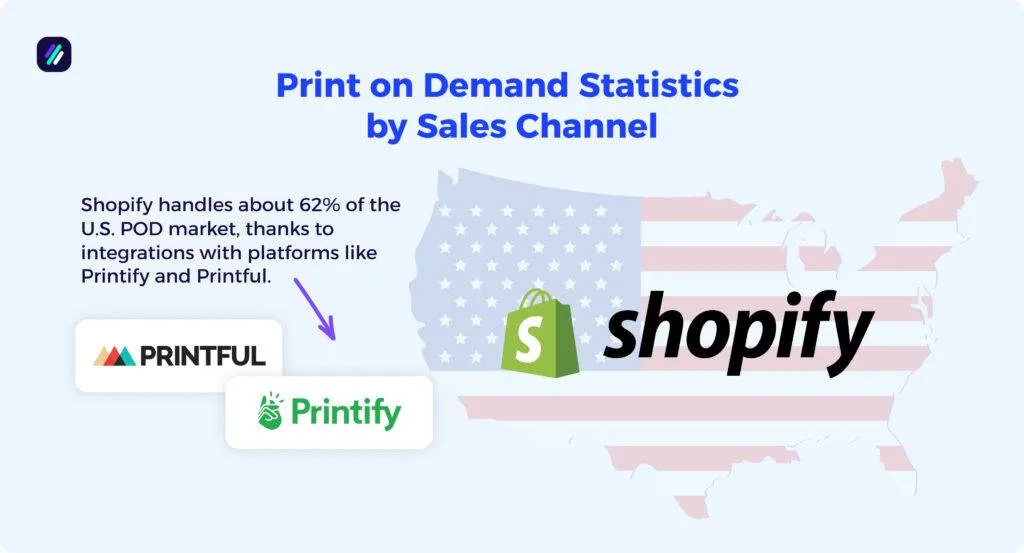
- Shopify handles about 62% of U.S. POD transactions, thanks to integrations like Printify and Printful.
- Nearly 40% of yearly POD sales happen in Q4, driven by holiday shopping.
- 81% of customers prefer buying from brands that offer personalized products.
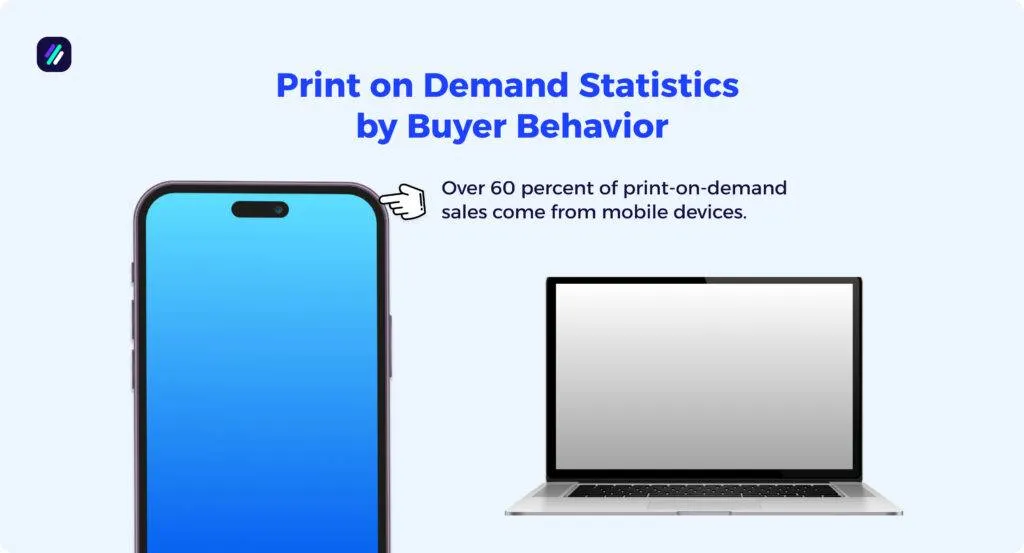
- Mobile devices drive over 60% of all print-on-demand sales.
- Printify fulfills over 1 million orders each month for global sellers.
- Stores using TikTok Pixel see a 15% increase in organic reach and traffic.
Print on Demand Statistics by Market Size
- The global market is now worth over 12 billion dollars and could reach 19.8 billion by 2029.
- North America brings in the most, with more than 36 percent of the global total.
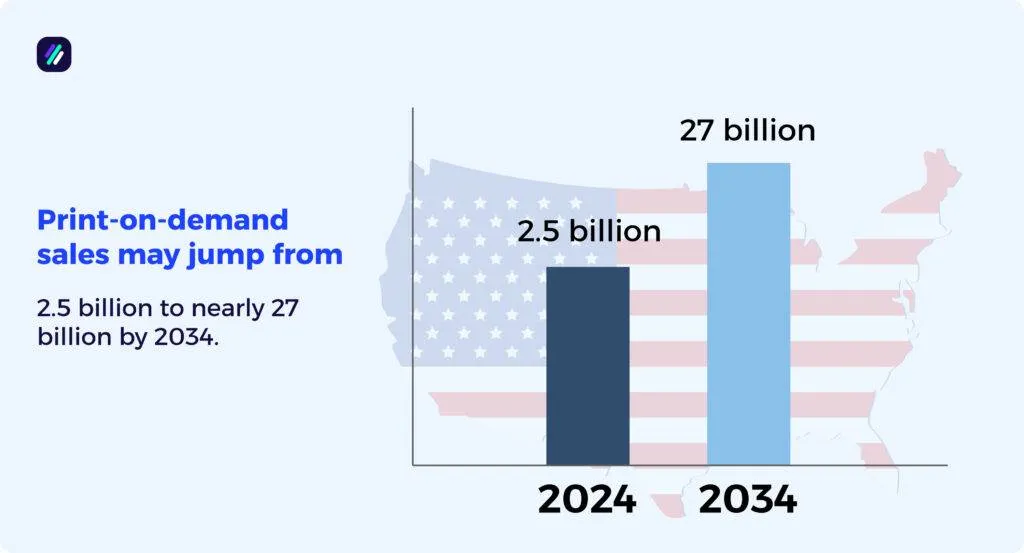
- In the U.S., print-on-demand sales may jump from 2.5 billion to nearly 27 billion by 2034.
- Asia-Pacific is growing the fastest. Reports say it’s picking up speed at around 27 percent a year.
- Europe is steady too, especially the UK and Germany. Sales there are expected to top 12 billion by 2032.
- Most of the money comes from custom t-shirts, hoodies, and clothing. That’s nearly 40 percent of the market.
- Other big categories are home goods, drinkware, and accessories like bags and hats.
- If growth keeps up, the global print-on-demand space could pass 40 billion in the next five years.
Print on Demand Statistics by Region
- The U.S. market is expected to grow from $2.5 billion in 2024 to nearly $27 billion by 2034.
- Asia-Pacific is growing faster than any other region, with a projected CAGR close to 28%.
- Europe holds a strong second place, especially the UK and Germany, which make up over half the region’s POD sales.
- North America brings in over 36% of the total POD market, with the U.S. leading both in sellers and customer demand.
- In Canada, dark heather is one of the top-selling t-shirt colors.
- Sand and sport gray are trending colors in Germany and Australia, especially for t-shirts and sweatshirts.
- Military and forest green apparel is more popular in Europe than in Australia, where lighter blues and neutrals perform better.
- Global buyers consistently pick black, white, and navy as their favorite colors for clothing.
Print on Demand Statistics by Season
- Black Friday and Cyber Monday can lead to a 3× spike in daily order volume.
- Sales for Christmas-themed products begin rising in early November and peak by mid-December.
- Valentine’s Day items can drive a 20% increase in jewelry and mug orders during late January.
- Back-to-school products like hoodies and notebooks see a 15% jump in sales in August.
- Q1 is the slowest quarter, with total POD sales dropping by up to 25% after the holidays.
- Nearly 40% of annual POD sales happen in Q4, driven by holiday shopping.
- Shops that launch seasonal collections at least four weeks in advance convert 35% better.
- Holiday-themed designs account for over half of all bestsellers during major gifting seasons.
Print on Demand Statistics by Sales Channel
- Around 40% of active POD sellers list products on Etsy.
- Amazon, eBay, and Shopify also rank high as POD sales channels, with Etsy and Amazon favored for lower startup costs.
- Shopify handles about 62% of the U.S. POD market, thanks to integrations with platforms like Printify and Printful.
- On Amazon, t-shirts, mugs, and tote bags are the most common POD items listed.
- Sellers using TikTok Pixel on their stores are 15% more likely to generate organic reach.
- Stores that blog and rank in search tend to attract nearly twice the traffic over time.
- Many high-performing print-on-demand stores use 10+ apps and spend about $75 a month on optimization tool.
Print on Demand Statistics by Product Type
- Apparel makes up about 40 percent of all POD sales, with t-shirts leading the category.
- T-shirts, hoodies, and sweatshirts are the top-selling clothing items across all platforms.
- Home decor is growing fast, with a CAGR of over 27 percent through 2030.
- Mugs, posters, and pillows are among the top-performing non-apparel products.
- About 60 percent of home decor sales come from one-size items like mugs and canvas prints.
- Pet products now make up a growing share of listings, especially beds, bandanas, and bowls.
- Jewelry and accessories like tote bags and socks are steady sellers, especially for gifting seasons.
Print on Demand Statistics by Buyer Behavior
- 81 percent of customers say they prefer to buy from brands that offer personalized products.
- About 36% of shoppers expect personalized products by default, and nearly half are fine waiting longer for them
- Nearly 50 percent are fine waiting longer if it means getting a custom item they really want.
- Over 60 percent of print-on-demand sales come from mobile devices.
- One-color, one-size items sell faster, especially for non-clothing products like mugs and notebooks.
- Stores with reviews and photos from real buyers see higher conversions.
- Shoppers are more likely to buy products that use simple color choices, with most preferring 1 to 5 options.
- More than 50 percent of shoppers say they’ll pay more for sustainable POD items.
- Most purchases are under $40, so keeping products affordable helps close the sale.
Print on Demand Statistics by Platform and Tools
- Canva and Photoshop are the go-to design tools, but beginner tools like Product Creator are catching up.
- Stores that use automation for fulfillment and mockups save time and launch products faster.
- Many sellers publish 10 new listings a week, improving their odds of generating a sale.
Print on Demand Statistics by Design Trends
- Products with one design element account for 56% of all POD sales.
- Listings with two design elements add another 24%, showing that simple layouts dominate.
- Over 75% of top-selling POD listings use text-only or text-plus-image designs.
- Around 65% of sellers use pre-designed artwork rather than customer uploads.
- AI tools now power design creation for at least 40% of new POD merchants.

- Retro and minimalist styles make up more than a third of trending apparel listings.
- Quote-based or funny designs rank among the top three themes in shirts, mugs, and posters.
- The most used color themes across products are black, white, and pastel tones.
Print on Demand Statistics by Product Categories
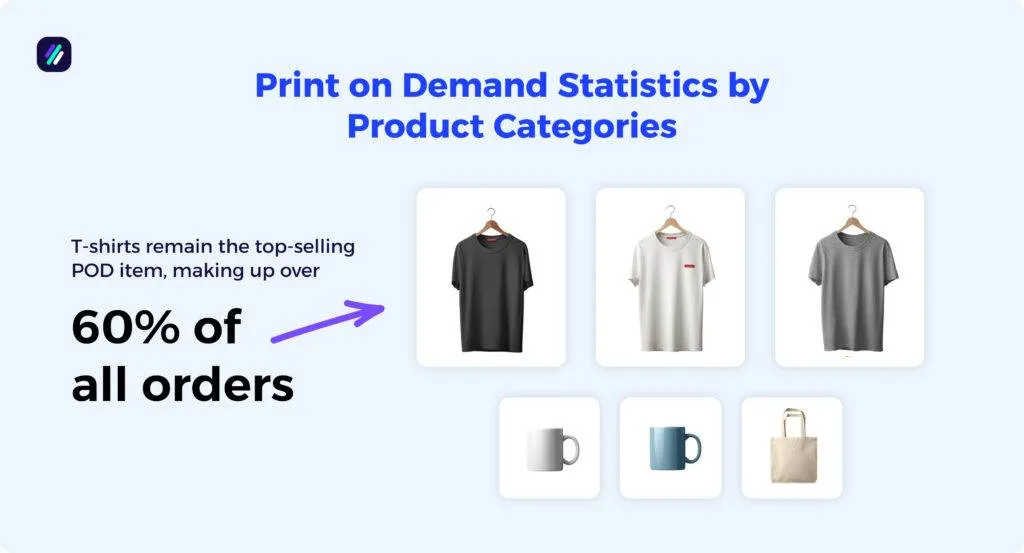
- T-shirts remain the top-selling POD item, making up over 60% of all orders.
- Mugs, posters, and hoodies follow, with mugs alone accounting for about 15% of global POD sales.
- Tote bags and phone cases have grown steadily, especially among Gen Z buyers.
- Stickers are one of the most common entry-level products for new POD sellers.
- Wall art and canvas prints are increasingly popular with Etsy-focused shops.
- POD jewelry and accessories are gaining traction in the custom gift market.
- Pet products like custom bowls and shirts have seen double-digit year-over-year growth.
- Seasonal items, especially holiday-themed clothing and décor, perform best in Q4.
Print on Demand Statistics by Supplier and Fulfillment
- Printify and Printful are the most-used POD platforms, with millions of active users worldwide
- Gelato, Gooten, and Teespring make up the next tier of supplier usage.
- Printify alone fulfills over 1 million orders every month.
- Most POD orders ship within 3 to 5 business days, depending on the product and provider.
- Fulfillment time is the top factor influencing repeat purchases, followed by product quality.
- North America and Europe are the most common fulfillment locations.
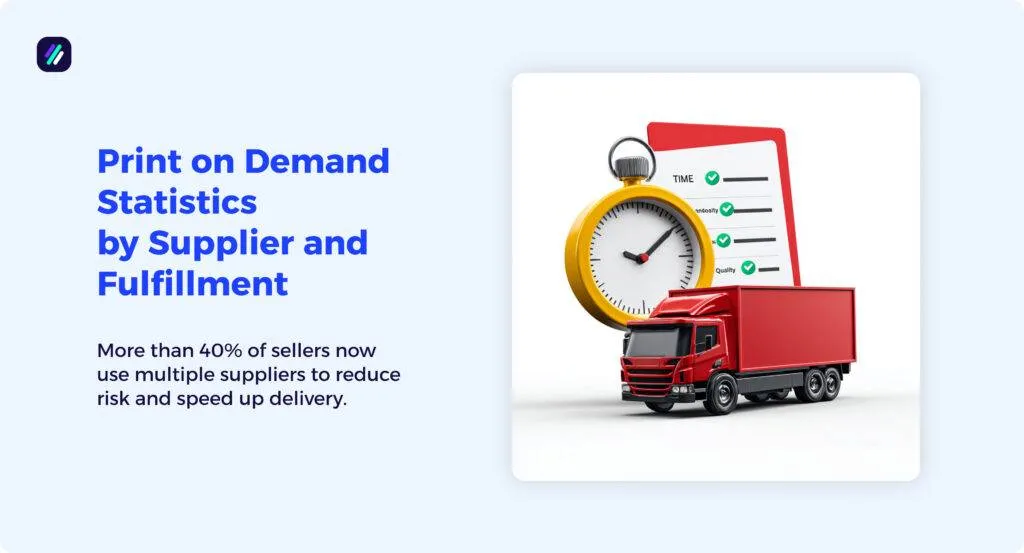
- More than 40% of sellers now use multiple suppliers to reduce risk and speed up delivery.
- Eco-friendly packaging and local printing options are rising in demand
Print on Demand Statistics by Ads and Marketing
- Stores using TikTok Pixel see a 15% lift in organic traffic and reach.
- Email marketing in Shopify and other stores helps retain customers, with open rates for custom gift stores reaching over 40%.
- Sellers who blog or use SEO for their store pages often get twice the traffic over time.
- Top POD brands post 3–5 times a week on platforms like Instagram and Pinterest.
- User-generated content like reviews with photos helps drive up conversion on Etsy and Amazon.
- Shopify sellers spend around $75 a month on store apps, many of which support SEO or marketing.
- High-performing POD stores focus on clear value, strong visuals, and fast-loading mobile pages.
Other Statistics Posts:
- 70 Important Shopify Statistics
- 60 Important Dropshipping Statistics
- 47 Important Product Research Statistics
- 82 Most Important E-Commerce Statistics
- 59 Important eBay Statistics
Useful Print on Demand Resources
- Print on Demand vs Dropshipping: Which Is Better for You?
- How to Sell Shirts on Shopify: The Ultimate Guide
- Thrift Store Flipping: 10 Easy Items You Can Flip for Profit