
Are you starting a new store and wondering which products to sell? You’ve come to the right place.
We’ve put together the key product research stats that show you what’s working for successful sellers right now.
Browse through the data to see what helps people find products that make money in 2026.
Key Product Research Statistics
- Over 80% of top eCommerce sellers say product research is the most important step in building a successful store
- Products chosen using research tools are 50% more likely to become bestsellers in the first 90 days
- Sellers who follow a research process see 2x better conversion rates than those relying on gut feel
- Nearly 63% of failed stores admit they didn’t spend enough time validating demand before launching
- Products with fewer than 100 competitors and at least 3 unique selling points are 2.7x more likely to succeed
- 73% of impulse purchases are driven by novelty, design, or personalization
- Over 60% of successful sellers use at least one dedicated research tool like ZIK or AliShark
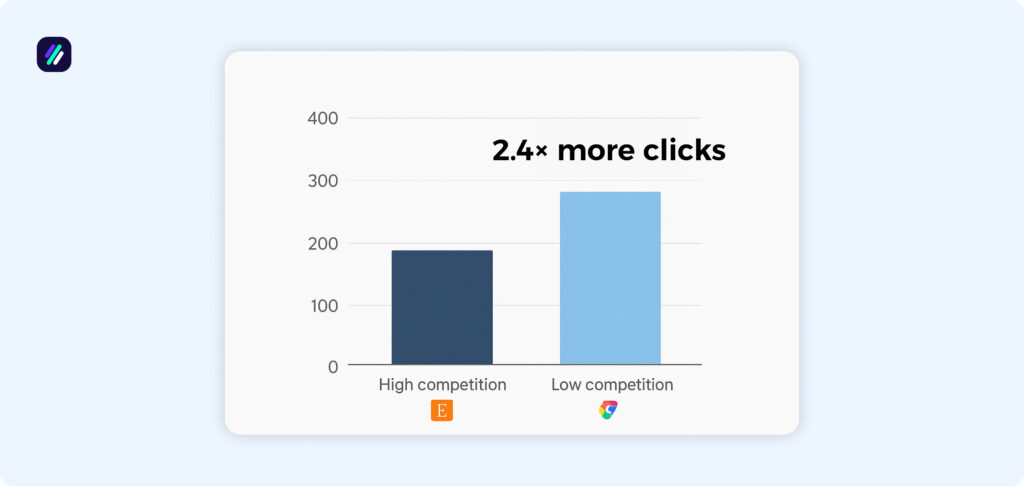
- Keywords with low competition but 1,000+ monthly searches drive 2.4x more clicks on platforms like Etsy
- Winning products usually fall within the $20 – $40 retail range across Shopify and Etsy
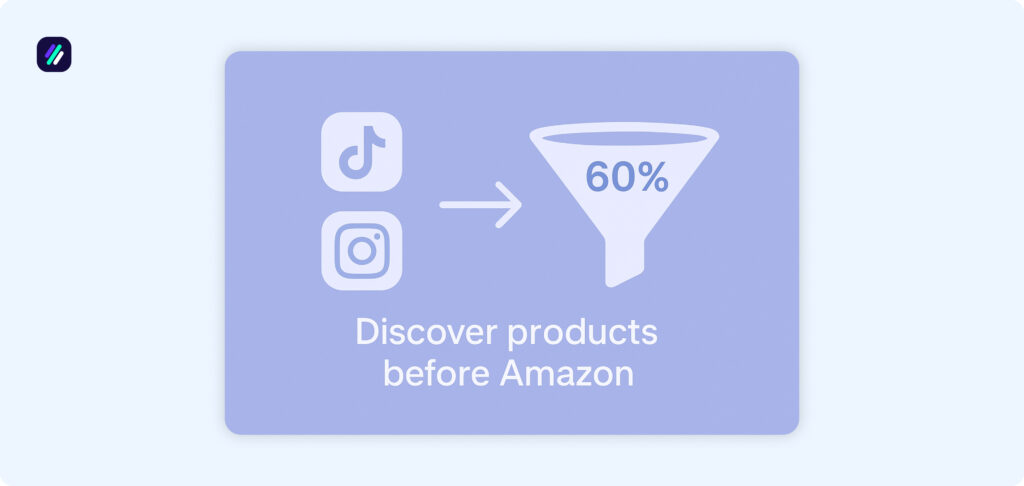
- Nearly 60% of buyers discover new products through social platforms like TikTok and Instagram before hitting Amazon
Product Research Statistics by Seller Behavior
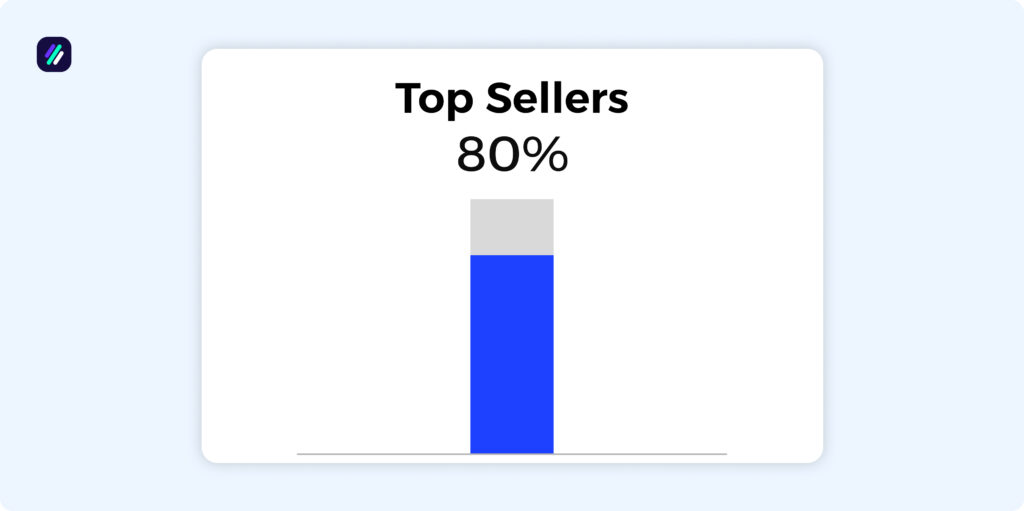
- Over 80% of top eCommerce sellers say product research is the most important step in building a successful store.
- Nearly 63% of failed stores admit they didn’t spend enough time validating demand or competition before launching.
- Most winning stores update their product lineup every quarter, based on new research and market signals.
- On average, sellers spend 4 to 6 hours per week researching products, keywords, and competitors.
- Products chosen using research tools are almost 50% more likely to become bestsellers in the first 90 days.
- Sellers who follow a research process tend to see 2x better conversion rates than those relying on gut feel.
Product Research Statistics by Tool Usage

- More than 60% of successful sellers use at least one dedicated product research tool like ZIK or AliShark.
- Sellers who use Chrome extensions for AliExpress research cut product testing time by 40%.
- ZIK Analytics users report 70% faster validation of eBay demand due to historical sales tracking.
- Tools with TikTok trend tracking features have grown 3x in user base since 2022.
- Product databases with filters like price, margin, and competition improve research efficiency by over 50%.
- Over half of new sellers rely on pre-curated product lists, though custom-filtered research performs better long term.
Product Research Statistics by Validation Tactics
- Around 70% of successful sellers say they rely on search volume tools like Google Trends or EtsyHunt to validate product ideas.
- Using “problem-solving” as a product filter leads to 2.2x higher success rates in dropshipping and Amazon FBA niches.
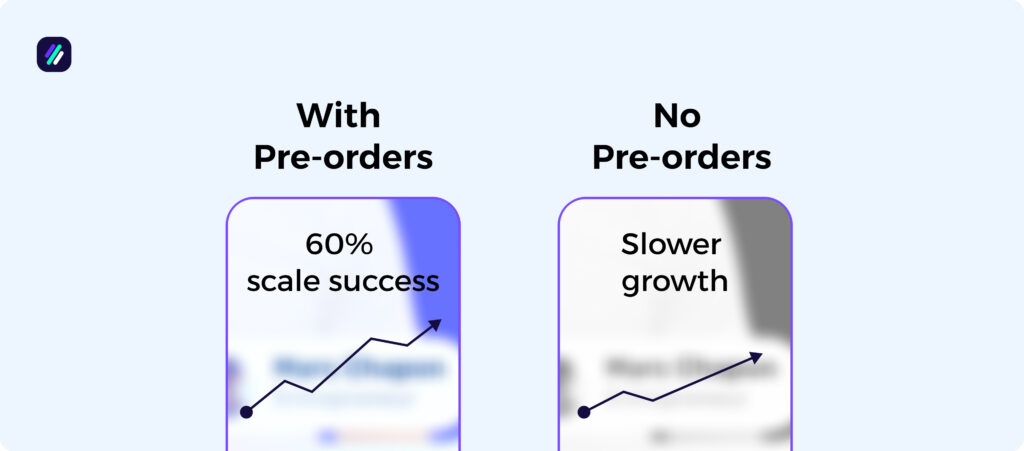
- Sellers who test demand using pre-orders or waitlists are 60% more likely to scale their products long term.
- Products with at least 10 organic keywords ranking on Etsy tend to get 4x more visibility than listings relying on paid ads.
- More than half of top sellers run test listings for 2 to 4 weeks before committing to bulk inventory or new campaigns.
Product Research Statistics by Visual Trends
- Listings with mockups showing lifestyle use get 3x more clicks on Etsy and Amazon Handmade.
- Products using “real person” photos in thumbnails see a 47% higher click-through rate on average.
- Flat lay product images (especially for apparel and accessories) lead to 25% higher conversion on mobile.
- Bright, high-contrast backgrounds are used in more than 60% of winning TikTok and Instagram product videos.
- Thumbnail images that show color variety increase time-on-page by 35%, helping with marketplace algorithm rankings.
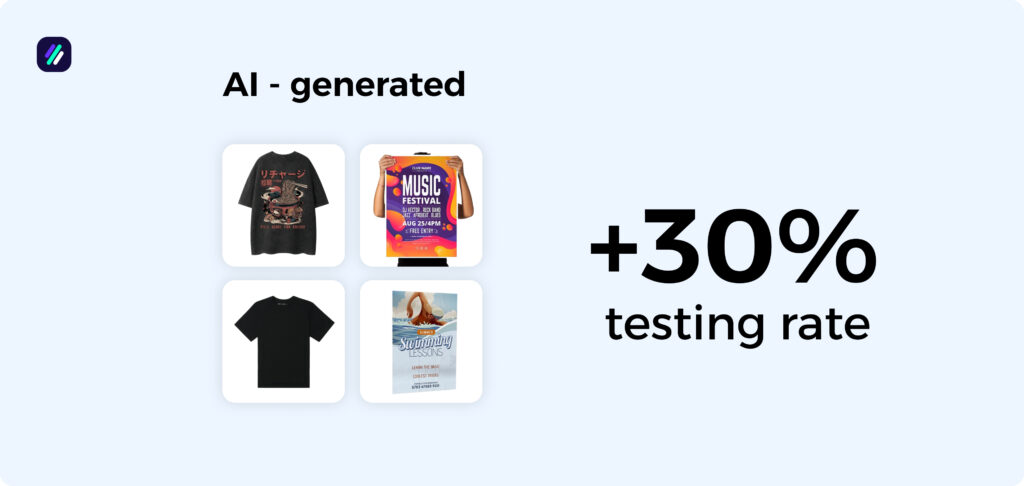
- New sellers using AI-generated visuals are now 30% more likely to test 5+ variations before choosing a design direction.
Product Research Statistics by Competitive Gap
- Products with fewer than 100 competitors and at least 3 unique selling points are 2.7x more likely to succeed in the first 60 days.
- Keywords with low competition but over 1,000 monthly searches drive 2.4x more clicks on platforms like Etsy and Google Shopping.
- More than half of profitable Etsy stores target underserved micro-niches (e.g., dog memorial gifts or minimalist nursery art).
- Using tools that compare seller count versus buyer search volume improves product selection accuracy by 55%.
- Listings in categories with low social ad saturation (under 5 paid results per keyword) tend to convert up to 30% better.
Product Research Statistics by Buyer Trends
- 67% of online shoppers say they prefer products that follow seasonal or trending aesthetics.
- Nearly 60% of buyers discover new products through social platforms like TikTok and Instagram before they ever hit Amazon.
- 73% of impulse purchases are driven by novelty, design, or personalization.
- Eco-friendly product tags increase conversion by up to 23% in categories like home goods and apparel.
- Products with fewer than five variants (color, size, etc.) convert 1.7x times better than those with too many confusing options.
- 42% of shoppers say they are more likely to buy when the product listing includes trending keywords or phrases.
- 1 in 3 customers expect at least one new product or variant from their favorite brand every month
Product Research Statistics by Supplier Sourcing
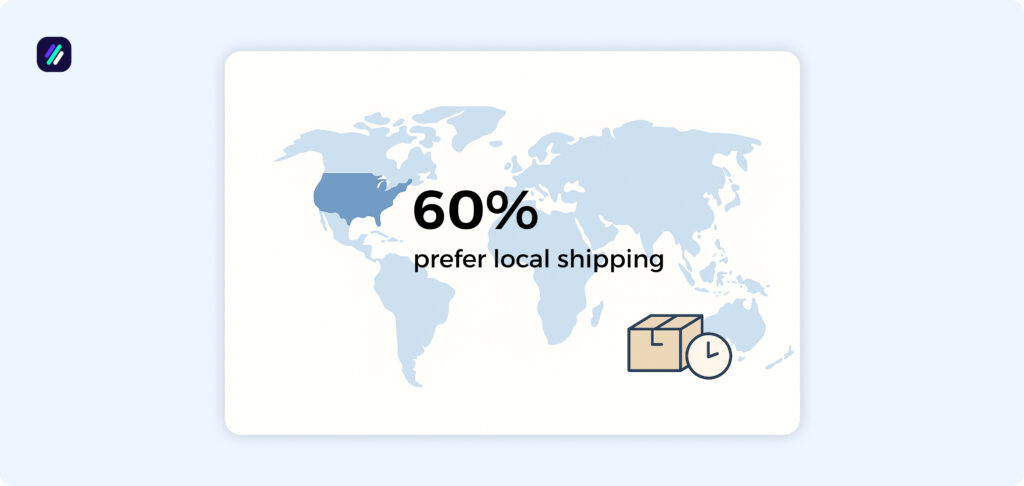
- Over 60% of dropshipping sellers prefer suppliers that offer U.S. or EU shipping for faster delivery.
- On AliExpress, products with 1,000+ orders and a 4.7-star rating or higher are 3x more likely to be picked by new sellers.
- Private suppliers found through dropshipping agent networks or platforms like Zendrop have 25 – 35% higher profit margins on average.
- Sellers using print-on-demand platforms like Printify and Printful choose suppliers based on fulfillment speed first, then price.
- Products shipped from local warehouses reduce refund requests by nearly 20%.
- Supplier switching happens in 1 of 4 stores after poor delivery performance or inconsistent product quality.
Product Research Statistics by Pricing and Profitability

- Winning products usually fall within the $20 to $40 retail range across Shopify and Etsy.
- A 3x markup over cost is the common baseline for evaluating POD or dropshipping product potential.
- Products with $10 – $20 margin tend to support paid ads better without hurting profits.
- Adding a customization fee increases average order value by 15% to 25%.
- Most successful stores price new items within 5% of top competitors to stay competitive without racing to the bottom.
- Free shipping baked into the product price improves conversion rates by up to 28%.
Other Statistics Posts:
- 70 Important Shopify Statistics
- 60 Important Dropshipping Statistics
- 47 Important Product Research Statistics
- 82 Most Important E-Commerce Statistics
- 80+ Important Print on Demand Statistics
- 59 Important eBay Statistics
- Facebook Statistics, Trends, & Facts
- 90 Instagram Statistics to Prepare for eCommerce
Useful Product Research Guides
- How to Find Winning Products to Sell for Beginners
- Top 10 Online Marketplaces to Sell Your Products
- How to Find High Demand Low Competition Products
- One Product Shopify Store: Strategies for Success