TikTok has become one of the biggest platforms in the world since the pandemic, especially among Gen Z users who spend hours consuming content every day.
But many people still underestimate its potential for ecommerce. From affiliate marketing and organic product promotion to the rapidly growing TikTok Shop marketplace, the platform has become a major driver of online sales and brand discovery.
In this article, we are going to talk about the latest stats about TikTok and the current trends on where it is going.
Top TikTok Statistics
- TikTok generated $33.2 billion in GMV, growing 201% year over year.
- That growth is accelerating, with projections reaching $66.2 billion in GMV.
- The platform already supports 870 million global TikTok Shop shoppers, showing massive buyer scale.
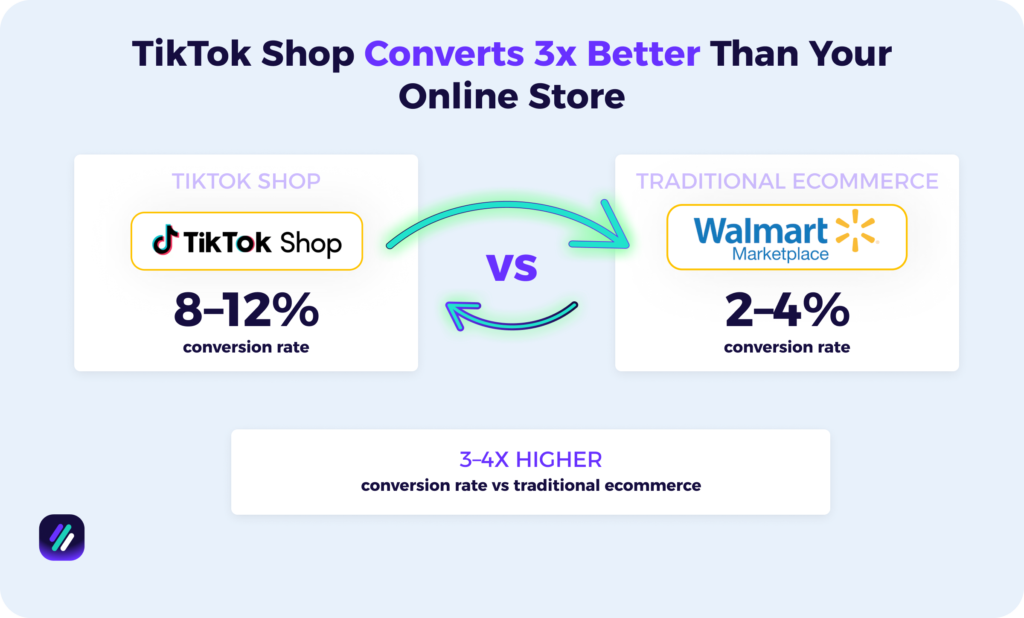
- This is driven by unusually strong performance, with 8–12% conversion rates compared to 2–4% in traditional ecommerce.
- At the center of this is content, where 58% of TikTok Shop sales come from short-form video.
- The platform’s reach reinforces this, with 1.9 to 2 billion monthly active users globally.
- Users spend 1 hour and 37 minutes per day on TikTok, creating constant exposure to products.
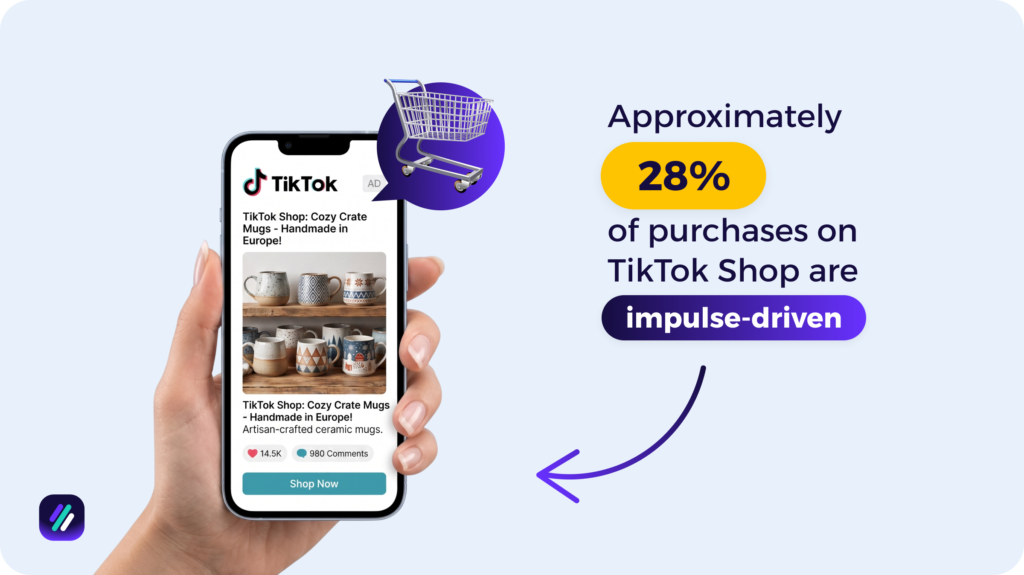
- This environment encourages behavior shifts, with around 25% of purchases being impulse-driven.
- Trust also plays a major role, as 63% of users rely on influencer recommendations.
- That influence directly converts, with approximately 50% of purchases coming from influencers.
TikTok Demographic and Regional Statistics
- TikTok has 1.9 to 2 billion monthly active users globally, making it one of the largest social platforms today.
- Users aged 25 to 34 make up 35.3% of the platform, followed by 18 to 24 at 30.7%, forming the dominant audience segments.
- Around 72% of Gen Z users have a TikTok account, and 95% actively use the platform, making them the most engaged demographic.
- TikTok’s gender distribution stands at 55.7% male and 44.3% female users globally.
- The United States leads with 136 million TikTok users, followed by Indonesia with 108 million users.
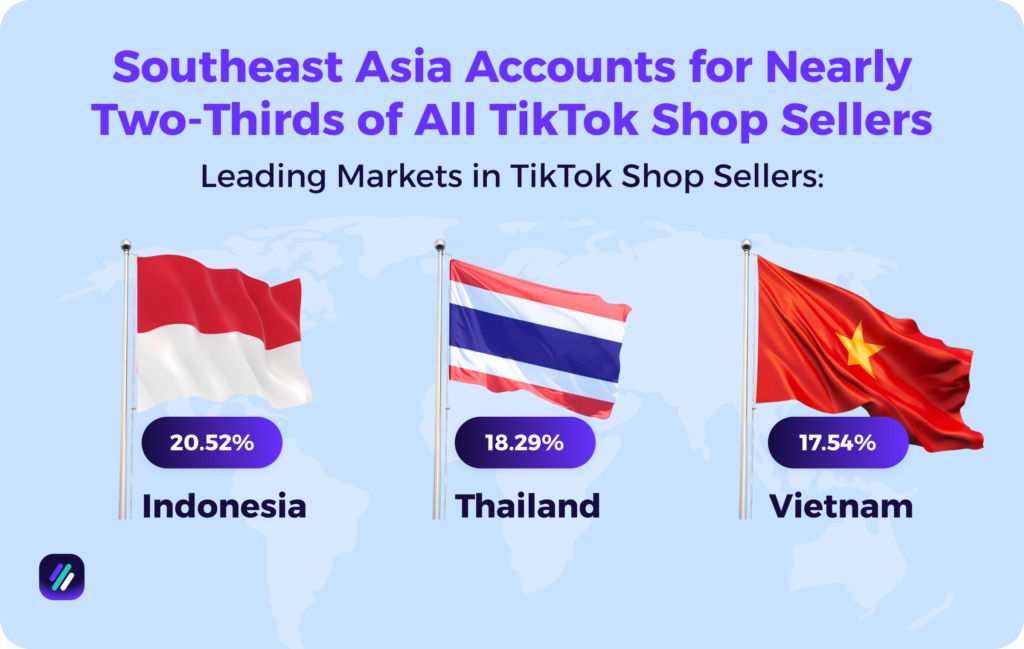
- Southeast Asia accounts for nearly two-thirds of all TikTok Shop sellers, with Indonesia (20.52%), Thailand (18.29%), and Vietnam (17.54%) leading globally.
- TikTok ecommerce demand is strongly influenced by younger and female users, particularly in categories like beauty, fashion, and personal care.
TikTok Usage Statistics
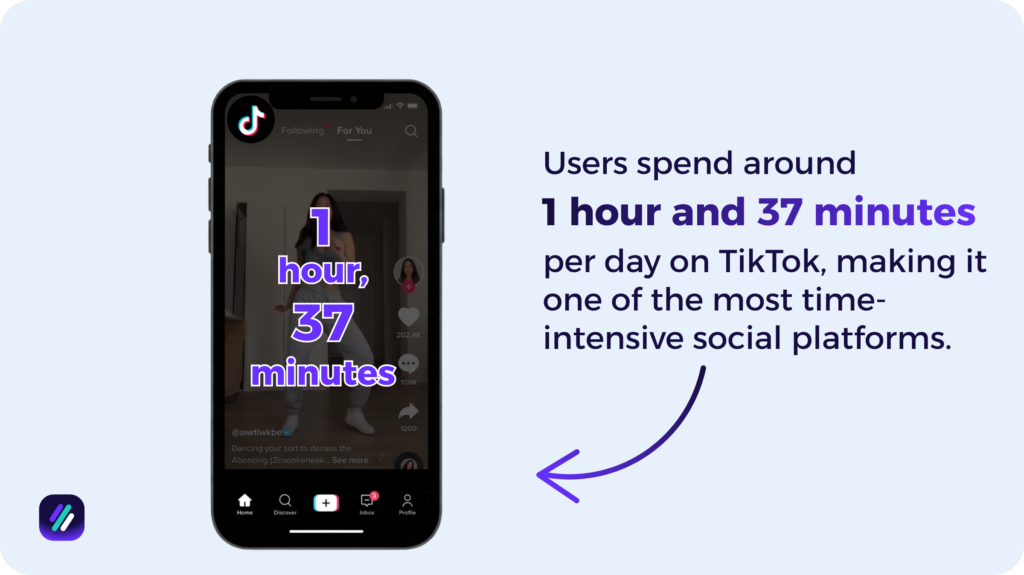
- Users spend around 1 hour and 37 minutes per day on TikTok, making it one of the most time-intensive social platforms.
- The average session lasts 9 minutes and 42 seconds, allowing users to consume multiple short-form videos in a single visit.
- Users open the app approximately 10 times per day, reinforcing frequent engagement loops.
- Around 23 million videos are uploaded daily, equivalent to roughly 16,000 videos per minute.
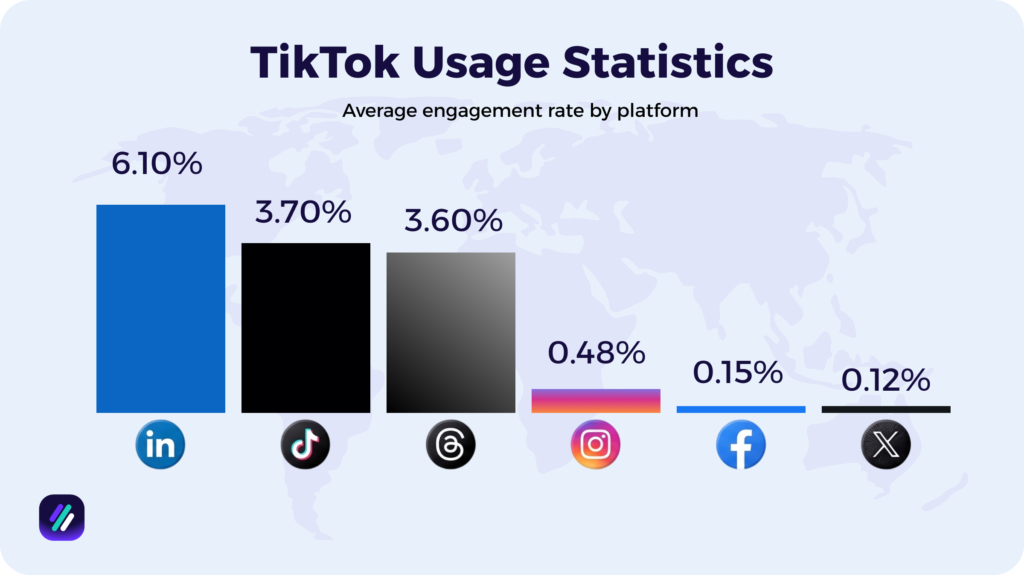
- TikTok maintains one of the highest engagement rate among social platforms at around 3.7%.
- About 55% of Gen Z users engage with brand content on TikTok daily.
- Approximately 37% of users use TikTok to follow trends and cultural moments.
TikTok Content & Algorithm Performance Statistics
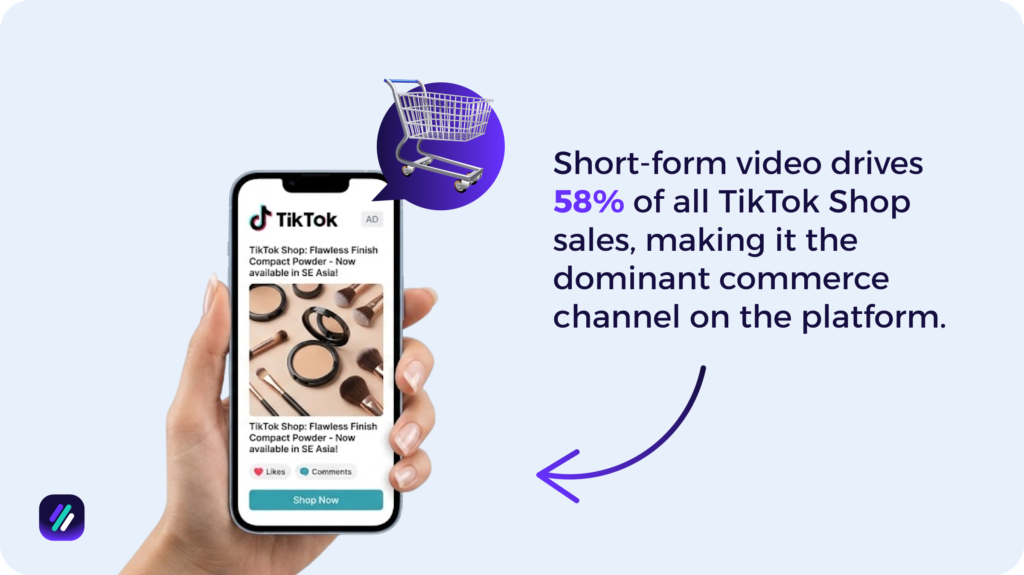
- Short-form video drives 58% of all TikTok Shop sales, making it the dominant commerce channel on the platform.
- TikTok’s algorithm enables product discovery without search, surfacing items directly through personalized content feeds.
- TikTok Shop achieves conversion rates between 8% and 12%, compared to 2% to 4% in traditional ecommerce.
- Videos under 60 seconds generate around 60% of user interactions, highlighting the effectiveness of short-form content.
- Approximately 30% to 50% of TikTok’s feed content is based on predicted user interests, driven by algorithmic recommendations.
- Users watch about 55% of recommended videos to completion.
TikTok Dropshipping Statistics
- TikTok Shop operates on a low-cost, high-volume model, with an average order value of around $59 per purchase.
- Users spend approximately $700 annually across around 12 purchases, indicating high purchase frequency.
- Average product prices dropped by about 14% across most categories, reflecting a shift toward affordability and volume-driven sales.
- Top-performing product categories include beauty and personal care, fashion, accessories, and household goods.
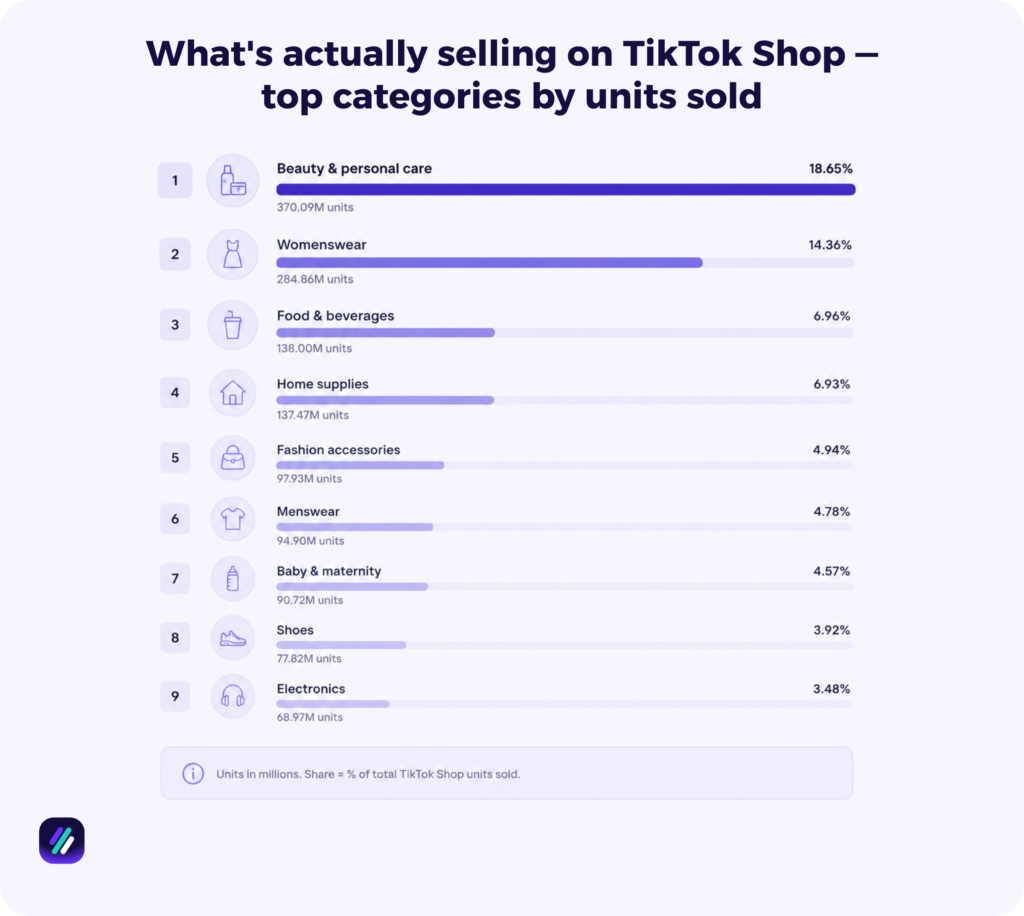
- Beauty and personal care leads product sales with 370.09 million units sold (18.65%), followed by womenswear at 284.86 million units (14.36%).
- Food and beverages generate 138 million units (6.96%), while home supplies reach 137.47 million units (6.93%).
- Fashion accessories account for 97.93 million units (4.94%), with menswear at 94.9 million units (4.78%).
- Baby and maternity products contribute 90.72 million units (4.57%), followed by shoes at 77.82 million units (3.92%) and electronics at 68.97 million units (3.48%).
- Regionally, TikTok Shop sales are concentrated in Southeast Asia, led by Thailand with 512.79 million units sold (25.84%) and the Philippines with 500.51 million units (25.22%).
- Malaysia contributes 311.03 million units (15.67%), followed by Vietnam at 296.21 million units (14.93%) and Indonesia at 272.9 million units (13.75%).
- The United States and the United Kingdom account for smaller shares at 2.27% and 2.14%, respectively, highlighting regional differences in adoption.
- Approximately 25% of purchases on TikTok Shop are impulse-driven, influenced by short-form content and immediate checkout options.
TikTok Shop Statistics
- TikTok Shop produced $15.82 billion in U.S. sales, accounting for 18.2% of total U.S. social commerce.
- TikTok Shop has 15 million sellers globally, forming a large and expanding marketplace.
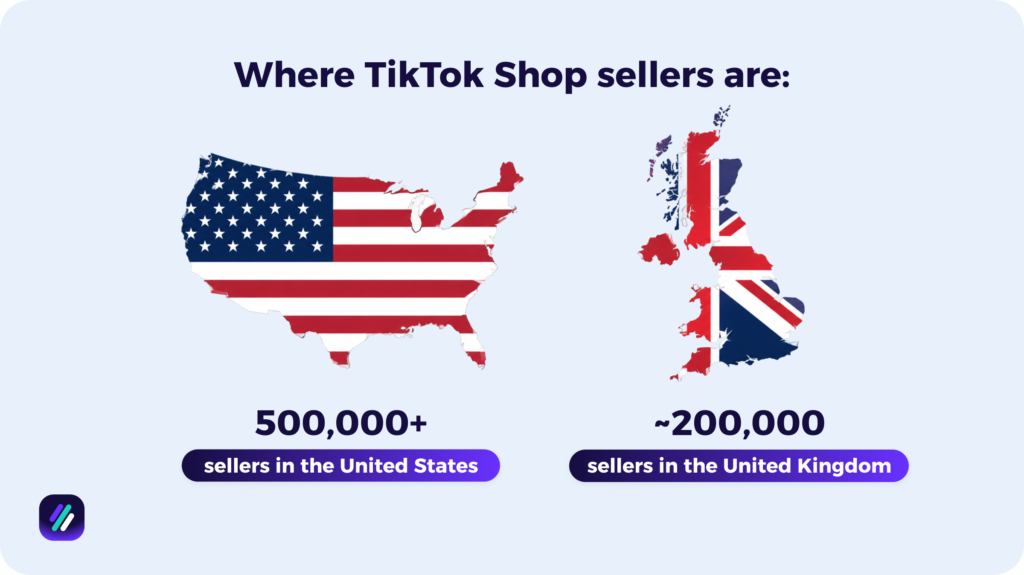
- There are over 500,000 sellers in the United States and around 200,000 in the United Kingdom.
- Approximately 171,000 U.S. small businesses sell through TikTok Shop.
- Around 37% of Americans under 60 have purchased from TikTok Shop, contributing to an estimated 870 million global shoppers.
- Beauty and personal care remain the leading category, followed by fashion, accessories, and home goods.
- In-app shop browsing contributes 32% of sales, while livestream commerce accounts for 10%.
TikTok Influencer Statistics
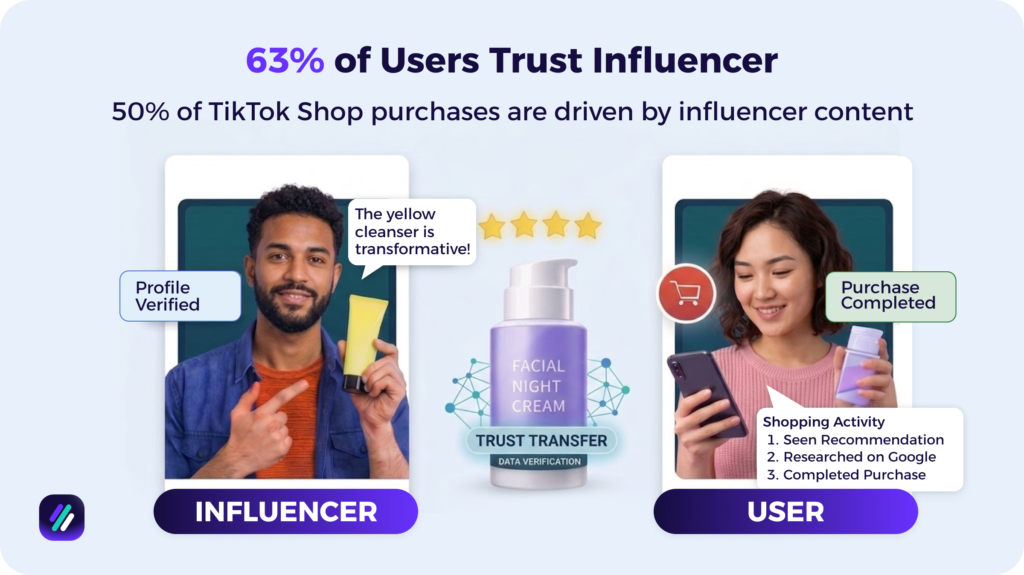
- Around 63% of users trust influencer recommendations when making purchase decisions.
- Approximately 50% of TikTok Shop purchases are driven by influencer content.
- Over 100,000 creators are participating in TikTok Shop affiliate programs.
- TikTok has an estimated 15.3 million influencers globally.
- Micro-influencers with under 50,000 followers achieve a 30.1% engagement rate, the highest among all creator tiers.
- Affiliate links on TikTok generate 5.2% engagement, which is 160% higher than on Instagram.
- Consumers are willing to spend an average of $95 on products recommended by trusted influencers.
- Only a small number of creators generate significant revenue, with 291 influencers exceeding $1 million in GMV.
- Among Gen Z users, 72% trust influencer recommendations.
- Around 71% of Gen Z consumers have purchased products they discovered on TikTok.
Other Statistics Articles
- Facebook Statistics, Trends, & Facts
- 70 Important Shopify Statistics
- 60 Important Dropshipping Statistics
Helpful Resources:
- TikTok Dropshipping: How to Get Started
- 14 Best Dropshipping Niches: Profitable Ideas to Start
- TikTok Dropshipping Products: 5 Viral Items That Actually Sell
Sources
- Analysis of TikTok’s E-commerce Model in Overseas Markets
- TikTok Shop Makes Up Nearly 20% of Social Commerce in 2025
- TikTok Shop Statistics (AfterShip)
- TikTok Statistics (Printful)
- 46 TikTok Stats to Inform Your Strategy (Sprout Social)
- Red Stag Fulfillment TikTok Shop Seller Statistics
- Survey: Americans Averaged Over $700 in TikTok Shop Purchases in the Last Year